Category Archives: Validation

3D density current on a slope

Another checkpoint on the road towards realistic fjord simulations was a three-dimensional simulation with inlet – outlet boundary conditions in a fjord-scale geometry. I chose the density current on a slope, since this case was previously tested both experimentally (e.g. Monaghan et al. 1999) and numerically (Özgökmen et al. 2004). The goal of this idealized set-up is to mimic the bottom gravity currents that provide dense water from marginal seas to general circulation. In the case of a fjord, the dense water will flow from general circulation into the fjord, so this test checks a number of boxes on our validation list: features 3d non-hydrostatic flow, uses anisotropic viscosity and salinity diffusivity, and tests time-dependent boundary conditions for velocity and salinity.

The domain spans 10km by 2km horizontally, with the bottom sloping from 400m depth at the inflow, to 1km at the outflow. We prescribe no-slip boundary condition at the ocean bottom, free-slip conditions at the ocean surface and domain sides. Salty water (dS=1psu) is placed at the top of the slope. The salinity initial condition is perturbed in the y direction such that a fully three-dimensional flow is eventually triggered. At the inlet, we prescribe a velocity profile which satisfies the boundary conditions and has a zero net mass flux, such that the salty water near the bottom comes in, and the fresh water near the surface gets out of the domain. The magnitude of incoming velocity is adjusted to match 80% of the transient front speed, so starts at 0m/s and quickly ramps up to a relatively constant value. A salinity profile matching the initial salinity distribution is also prescribed (for details see Özgökmen et al. 2004). At the outflow, we prescribe a no-stress condition, which allows the fluid to escape the domain.

This test is also an opportunity to validate a recent development of anisotropic viscosity, which is a common feature of ocean simulations due to vastly different horizontal and vertical scales. Following Özgökmen et al. 2004, we have chosen the values of horizontal and vertical viscosity to be \nu_h =1.17 m^2/s\nu_v =2.34\times 10^{-2} m^2/s. Prandtl number was set to Pr=1, so salinity diffusivities in horizontal and vertical have the same values as viscosities. Along with salinity contraction coefficient \beta=7\times 10^{-4} 1/\text{psu}, this led to Rayleigh number  Ra=5\times 10^6.

Mesh for this case is designed in GMSH, such that elements sizes vary from 50m near the bottom to 200m at the ocean surface. I have initially created an unstructured vertical mesh (in x-z plane) and then extruded it horizontally along y axis such that element size along y is also 200m. This was my initial 3D mesh, which was passed to NUMO. NUMO, using p4est, refined the mesh by one level, subdividing each element into eight smaller ones. I chose 4th order polynomial expansion in each element, which brought the effective resolution to approximately 6.25m near the bottom and 25m near the surface in the x-z plane, with 25m resolution in the y (perpendicular) direction.

Above is the visualization of the salinity field. The contours represent S>0.1psu, with warmer colors indicating saltier water. The unstructured x-z plane initial mesh is shown in the background (the actual mesh is refined by one level, i.e. each 2d element is subdivided into four smaller ones, plus there are nodal points within each element, depending on the expansion polynomial order). The front reaches the outflow in under 10000s. To compare the results with literature, we plot the evolution of front speed U_F, non-dimensionalized with the velocity scale  U_B = (g'Q)^{1/3}, where g' is the reduced gravity and Q is the spanwise averaged volume flux of salty water into the domain through the inlet (we do not account for the flow going out of the domain). The front speed is a derivative of the front position, obtained by looking at the maximum x coordinate of the spanwise averaged S=0.1psu contour.

Image shows the evolution of the density current front speed computed by NUMO and compared with computations of Ozgkomen et al. 2004 and the experiment of Monaghan et al. 1999 . NUMO compares very well with literature data

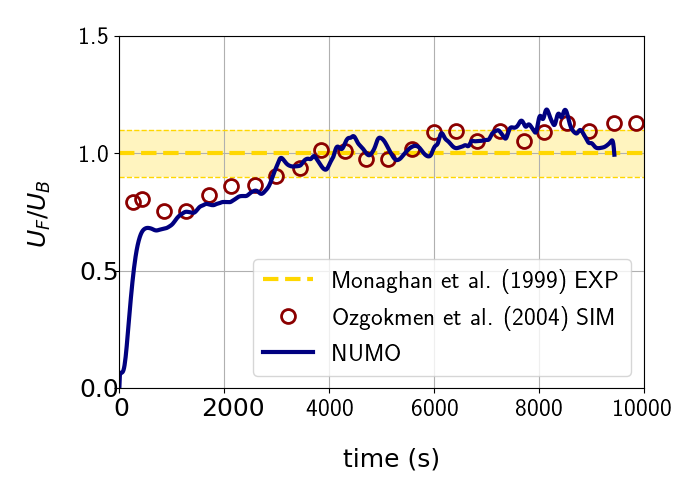
We see that the results are in a very good agreement with both simulation (circles) and experiment (dashed line with a yellow band for error range). Towards the end of the simulation, the measurement of front position is affected by the front reaching the outflow. The front seems to decelerate, while in fact some of it already traveled through the domain boundary and the measurement of average position is affected. The initial front acceleration seems to be slower in our case than in Özgökmen et al. 2004, which can be attributed to slightly different inflow condition set-up. In the middle part of the simulation, where the front has a relatively steady velocity, the match between our simulations is excellent. This result brings us a step closer to realistic fjord simulations, as it validates NUMO’s prediction of 3D buoyancy driven flows in realistic geometry scales.


As an aside, I wanted to make a quick comparison between two simulations of seemingly the same resolution, to illustrate the impact of the polynomial order on the simulation results. I used the initial mesh generated in GMSH, but rather than subdividing the elements in p4est, I have doubled the polynomial order.  With 8th order polynomials, we get effectively the same average distance between nodal points but compare the animation below to the previous one. You will notice that 8th order simulation has more detail and structure, indicating a better-resolved flow. Even though we use roughly the same number of points, higher order polynomials carry more information per point and thus provide better accuracy.

So this begs the question – is it fair to compare simulations based on resolution only? Not when you are comparing different numerical methods, apparently. So what would be a better metric? Obviously, a time to solution is a solid choice – but it also involves an overall performance of the code, the kind of machine the simulation was run on, etc. What is your take on this?

References:

Monaghan, J.J., Cas, R.A.F., Kos, A.M. and Hallworth, M., 1999. Gravity currents descending a ramp in a stratified tank. Journal of Fluid Mechanics, 379, pp.39-69.

Özgökmen, T.M., Fischer, P.F., Duan, J. and Iliescu, T., 2004. Three-dimensional turbulent bottom density currents from a high-order nonhydrostatic spectral element model. Journal of Physical Oceanography, 34(9), pp.2006-2026.

More insights into the lock-exchange test

In the past months, we have made significant advances in putting the NUMO prototype, which delivered results reported in this blog so far, back into the GNuMe framework. GNuMe stands for [G]alerkin [Nu]merical [M]odeling [E]nvironment and is a framework that hosts both NUMO and NUMA – Non-hydrostatic Unified Model of the Atmosphere. This merger allows NUMO to leverage a lot of  NUMA technology (both current and future, as the codes share the same infrastructure) and more rapid advancement in NUMO development. The benefits go both ways, as the development of NUMO brings in new features to NUMA as well. Now that we are happy with how the code infrastructure looks like, we can go back to evolving NUMO into a truly unstructured non-hydrostatic model.

Ever since we have obtained the first lock-exchange results, two issued bothered me. Firstly, we experienced some unphysical instabilities and mesh imprinting close to domain boundaries, particularly in the domain corners. Those instabilities eventually led to simulation crash at later times, way past the usual end time of the simulation when the fronts reach the wall. Regardless, we definitely cannot allow this in a production code. Secondly, we compared our results to those available in the literature, but there was quite a bit of spread between reported Froude (Fr) numbers among different researchers. Recently I have revisited those simulations, and I believe I found answers to both issues.

Since we were getting mostly correct physical behavior of the flow, I suspected  that the instabilities are simply due to not enough stabilization of the temperature field. Following Hiester et al. (2011), we used kinematic viscosity ν=1e-6 m^2/s for velocity, and no thermal diffusion. Given no numerical diffusion in the high-order continuous Galerkin method used for those simulations, we always require some stabilization, either through artificial diffusion, filtering, or other methods. I was using Boyd-Vandeven filters, but this was clearly not enough. I decided to introduce some physical diffusion to see if this will stabilize the simulation. Since I was locked in to kinematic viscosity of water at 20C, I decided to use matching thermal diffusion of κ=0.148e-6 m^2/s. The result was a very stable lock-exchange simulation, which I run till 500s with no trace of growing instabilities. Here is the video of the flow:

This led to a further investigation of the lock-exchange results. As mentioned before, Hiester et al. (2011) report the Grashoff number is Gr=1.25e6, with kinematic viscosity ν=1e-6 m^2/s and no thermal diffusivity (κ=0 m^2/s), which leads to Schmidt number Sc =  ν/κ = ∞. A similar set-up is found in the simulation by Fringer et al. (2006), but the reported Froude number is significantly different than Hiester et al. (see the table here). The authors, however, compare the result with the DNS simulation by Härtel et al. (2000), which provides yet another Fr value, and note the possible cause of this discrepancy. The simulation of Härtel et al. was made (apart from significantly higher resolution) with Sc=0.71, which with ν=1e-6 m^2/s gives the thermal diffusivity of κ=1.41e-6 m^2/s. Fringer et al. point out that even though they do not explicitly use thermal diffusivity, the numerical diffusion of the method (first-order upwinding) makes the Sc number lower than this of Härtel et al., and therefore their fronts are slower.

This led me to try two simulations with different values of Sc number, one with Sc=0.71 like in Härtel et al., and the other with Sc=6.74, which is the simulation shown in the video above. I have compiled the results in a table below, taking into account Sc numbers (all simulations with Gr=1.25e6).

Sc no-slip free-slip
NUMO 6.74 0.420 0.482
NUMO 0.71 0.407 0.475
Härtel et al. (2000) 0.71 0.406 0.477
Hiester et al. (2011) 0.417 0.482
Fringer et al. (2006) 0.396 0.428

It turns out that NUMO results match very well the DNS simulation by Härtel et al. when using matching Schmidt numbers, and the simulation of Hiester et al. when using high Sc. Even though Hiester is not using any thermal diffusivity explicitly, it is hard to evaluate the numerical diffusion of their model. The front speed in Fringer et al. is clearly slower than in other simulations, indicating much lower Schmidt number due to high numerical diffusion of the model.

This result gives me another bit of confidence in NUMO results, as it agrees with the DNS simulation very well, while also matching the result of high resolution adaptive finite element code of Hiester et al. (2011) by using only physical diffusivity.

References

Fringer, O.B., Gerritsen, M. & Street, R.L., 2006. An unstructured-grid, finite-volume, nonhydrostatic, parallel coastal ocean simulator. Ocean Modelling, 14(3–4), pp.139–173.

Härtel, C., Meiburg, E. & Necker, F., 2000. Analysis and direct numerical simulation of the flow at a gravity-current head. Part 1. Flow topology and front speed for slip and no-slip boundaries. Journal of Fluid Mechanics, 418, pp.189–212.

Hiester, H.R., Piggott, M.D. & Allison, P.A., 2011. The impact of mesh adaptivity on the gravity current front speed in a two-dimensional lock-exchange. Ocean Modelling, 38(1–2), pp.1–21. Available at: http://dx.doi.org/10.1016/j.ocemod.2011.01.003.

Verification of buoyancy and non-hydrostatic effects

Once we have verified the correctness of the implementation of CG/DG machinery, it is time to move on to more physical-like benchmarks. This time we are not able to rely on exact analytic solutions as we benchmark NUMO on a lock-exchange case, which is a standard test for non-hydrostatic ocean codes. An additional benefit of this set-up is that it can be studied experimentally. But what is the lock-exchange case exactly?

In a box of 0.8m x 0.1m x 0.1m we put two fluids side by side, one is warm and light and the other one cold and heavy. The temperature difference between them is set to 1C. To compare this set-up with other results from the literature, we use a Grasshoff number Gr=1.25e+06, which, with water viscosity of 1e-06, implies the thermal conductivity of 1e-03. We assume that there is no thermal diffusion present. We let the two fluids interact, with the difference in buoyancy of the fluids driving the flow. The movie below shows the simulation result. Note that even though we show only a 2D result, this is a full 3D simulation and we are showing only a middle plane of the solution.

The domain is bounded by a no-slip wall on the bottom, and all the other walls have free-slip condition prescribed. To compare this result with the literature, we track the velocity of the no-slip and free-slip fronts and report it as non-dimensional Froude number.

front_speed_presentation
The figure shows the Froude number plotted against the distance that each front traveled. We compare this result with the simulation by Hiester et al. and see that both results match very closely, even though the simulation of Hiester is much better resolved (dx=0.00025m, while we use an effective resolution of 0.001m, but also a higher order method). Close to the initial position both fronts go through a phase of acceleration, and at x=0.4m they hit the side-walls. There is, however, a period of relative steady velocity between x=0.2m and x=0.3m, so we average the Froude number there and compare with other literature results.

no-slip free-slip
NUMO 0.421 0.482
Hiester et al. (2011) 0.417 0.482
Fringer et al. (2007) 0.396 0.428
Hartel et al. (2000) 0.406 0.477

As expected, the NUMO result matches closely recent Hiester et al. publication. However, NUMO is also very close to Hartel et al. very-high resolution DNS. This result builds our confidence in the correctness of the buoyancy effects in our code, as well as the performance of temperature (and salinity, but not featured here) transport.

So what is next? This result is an important stepping stone to a full-fledged non-hydrostatic ocean model. We are ready to move towards more realistic, non-box geometries and idealized ice/ocean interaction tests in ISOMIP suite. To be able to call ourselves a real ocean model we still need the free-surface implementation, which is currently in the works.

NUMO dynamics validation

The first milestone in the development of NUMO was to make sure the equations driving the dynamics of the ocean are solved correctly. The underlying dynamics (i.e. velocity and pressure) in the model are governed by the incompressible Navier-Stokes equation (INSE). You can read more details on the equations and numerical methods that solve them on the Model page.

To validate the implementation of INSE in NUMO, we have used two benchmarks with analytic solutions: Kovasznay flow and Taylor vortex. For the purpose of these tests, we do not include buoyancy and Coriolis source terms.
Continue Reading NUMO dynamics validation